
Features
Everything that decides whether you can afford it
Real property data and your own numbers, side by side, for any of 14,000+ Australian suburbs.
Try the calculator free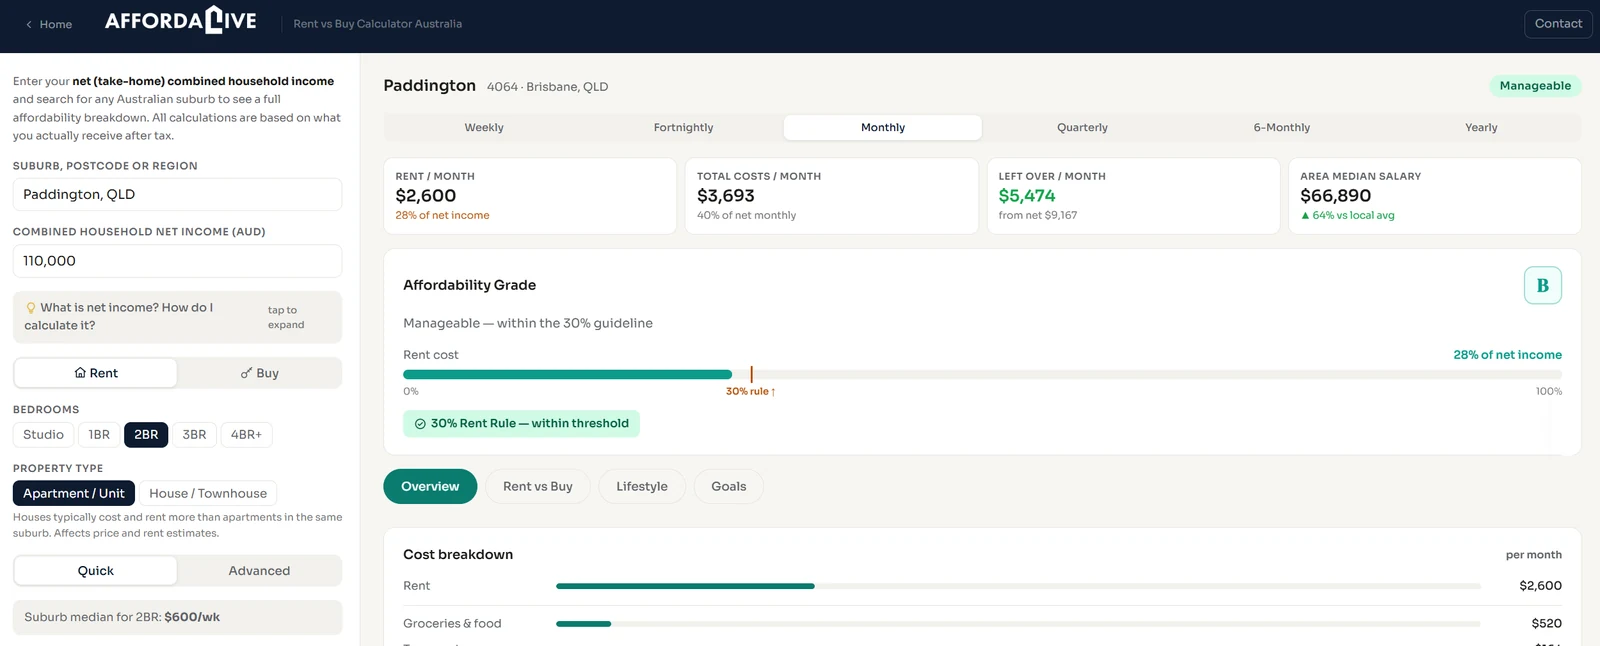
Who it's for
What it does for your situation
Not just for first home buyers. Whether you rent, are about to buy for the first time, or last bought years ago, here's what you get from the calculator and from a report.
Renting somewhere new
Free calculatorTypical rent for the bedrooms you need, as a share of your household income, plus the one-off cost of the move: bond, removalists and connection fees.
ReportA table of weekly rents so you can see which level fits your income, with up to 3 nearby suburbs scored side by side (Basic).
Rent going up
Free calculatorEnter the weekly rent you've been asked to pay and see what share of your income it now takes, graded against the 30% rule.
ReportCompare up to 3 nearby suburbs to see whether moving would change the numbers (Basic).
Renting, thinking about buying
Free calculatorRenting and buying compared in the same suburb over time, including the equity buying builds at an assumed growth rate.
ReportThe hidden costs of buying, rent vs buy and an action plan, in a shareable PDF.
First home buyer
Free calculatorDeposit, stamp duty, state concessions, LMI and ongoing costs. Tick first home buyer and the 5% deposit scheme is applied. It doesn't check your eligibility, so confirm that with your lender.
ReportDeposit, price and interest-rate scenarios, and a price-by-price table of repayments, cash to settle and what's left over.
Buying interstate
Free calculatorStamp duty and buying costs for the state the suburb is in, set against your income, so you can test a state you've never lived in.
ReportUp to 3 nearby suburbs scored and compared side by side (Basic). It doesn't cover what an area is like to live in.
Buying again, locally
Free calculatorToday's prices, stamp duty and running costs, and the equity the new home could build. What you paid years ago is a poor guide.
ReportThe same scenario and price-by-price tables. Selling your current home isn't modelled, so that needs its own calculation.
AffordaLive is for people who will live in the home. It isn't built for property investors. Reports cover affordability. Lifestyle fit, commute and schools are planned for Comprehensive reports, which aren't available yet.
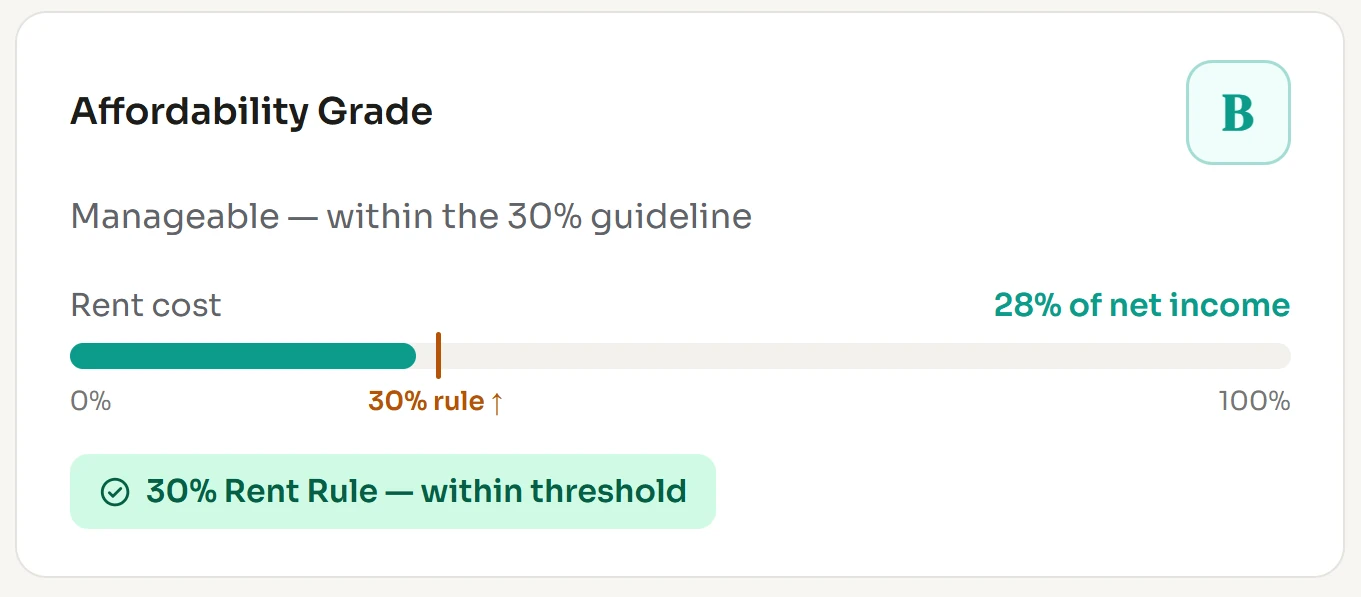
An instant A–F grade
Your housing cost as a share of take-home pay, graded against the 30% rule, an indicative affordability benchmark.
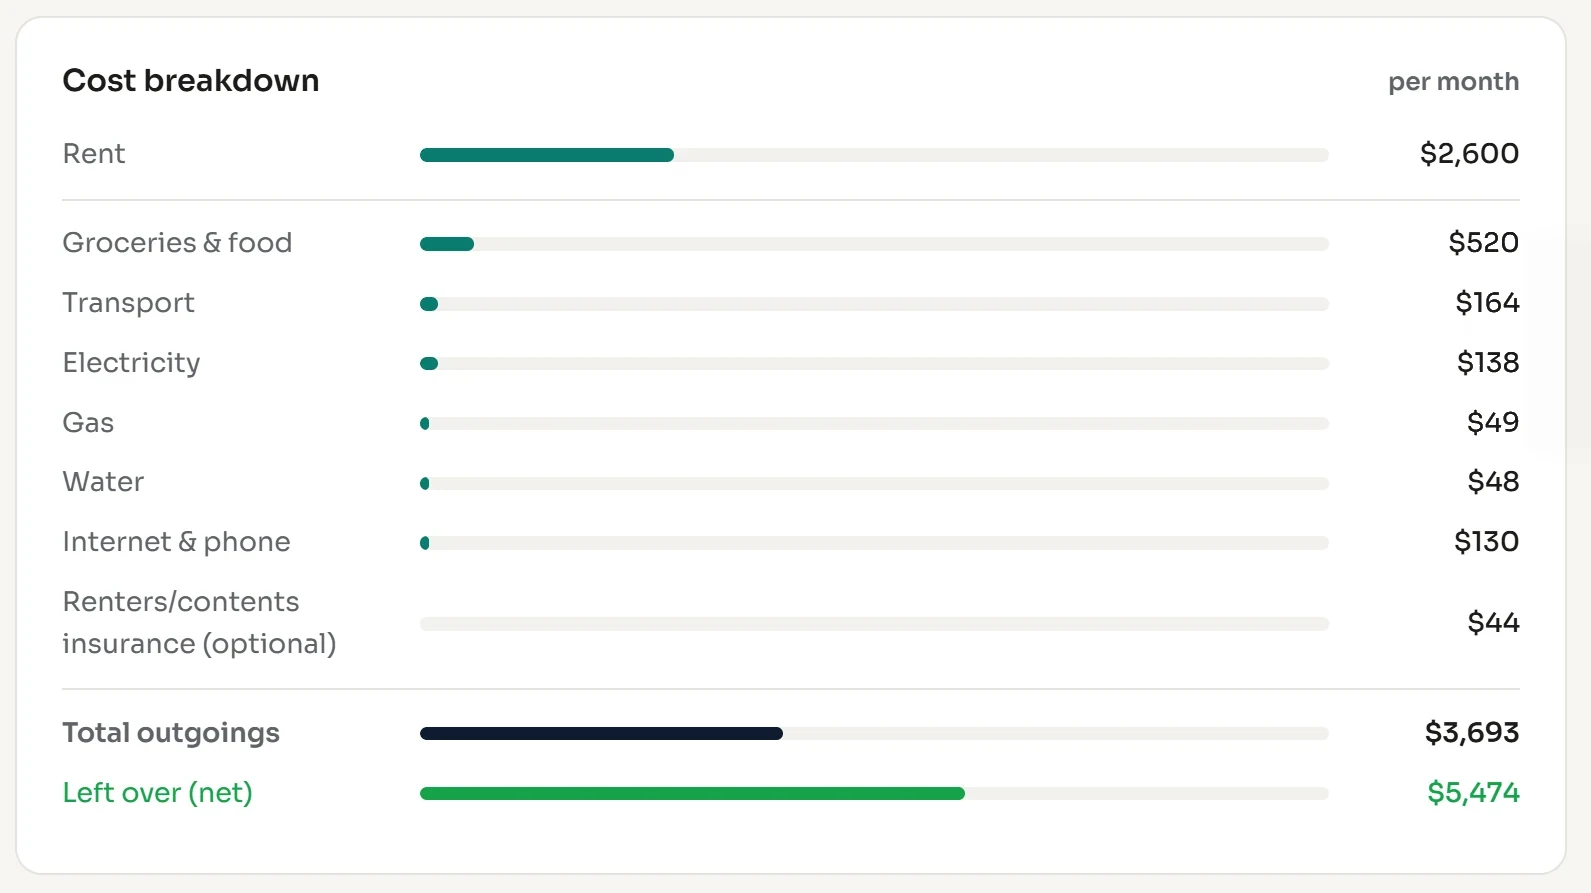
Every cost of living there
Rent or repayments plus rates, insurance, strata, maintenance, stamp duty and LMI, all calculated for you.
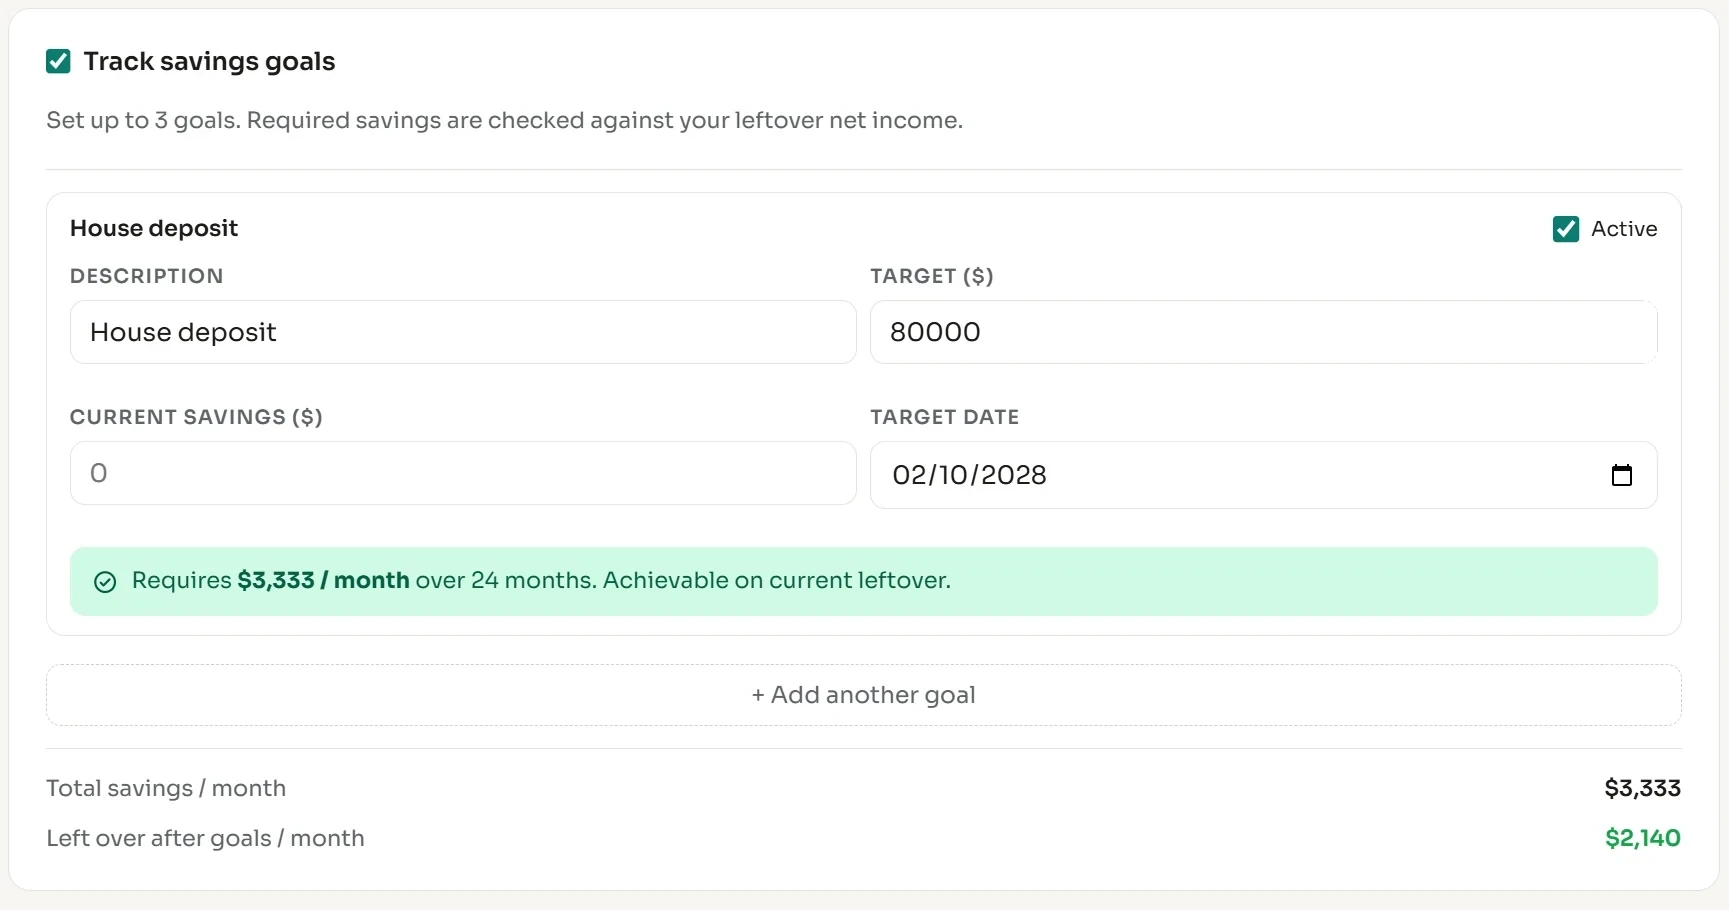
Goals that fit your budget
Add up to three savings goals and see what each needs per month, checked against what's actually left over.
14,000+ suburbs
Domain Insight prices and rents first, our own estimates filling the gaps, ABS Census for income.
First home buyer support
Stamp duty concessions and the 5% deposit Home Guarantee Scheme, applied automatically when you tick the box.
Advanced mode
Know better than the defaults? Enter your own price, deposit, rate and costs. How it works
How affordability is graded
Your grade is your housing cost as a share of net (take-home) income. Above 30% is considered stretched.
- AUnder 25%Comfortable
- B25–30%Manageable
- C30–40%Stretched
- D40–50%Stretched
- F50%+Unaffordable
What's counted
Both sides are costed the same way, so the comparison is fair.
Renting
- Weekly / monthly rent
- Utilities: electricity, gas, water
- Internet and phone
- Renter's insurance optional
- Pet insurance optional
Buying
- Repayments, principal + interest
- Stamp duty one-off
- LMI, if your deposit is under 20%
- Council rates
- Home and contents insurance if your lender requires it
- Utilities
- Maintenance est. 1% of value a year
 12345
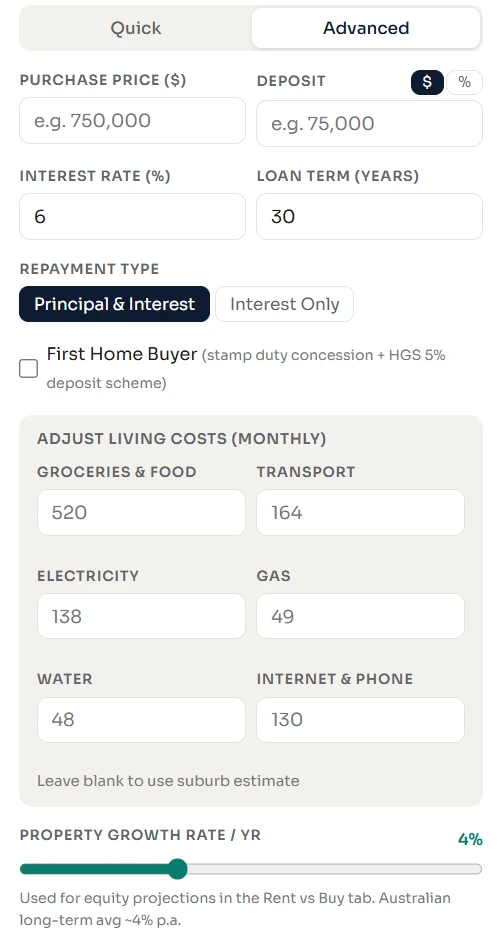
Advanced mode: use your own numbers
Don't trust the defaults, or know the suburb better? Switch to Advanced and change:
- 1Purchase price and deposit
- 2Interest rate and loan term
- 3Repayment type
- 4Your living costs
- 5Property growth rate
Good for "what-if" scenarios: a bigger deposit, a rate rise, a cheaper street.
Where the numbers come from
Every suburb's prices and rents are labelled with their source. We use the best available, in this order:
- 1

Suburb sale and rental data, updated monthly. Most suburbs.
- 2Regional and AffordaLive estimates
Where Domain has no sales for a suburb: the Domain median for its surrounding region, or our own estimate from government sales data.
- 3Nearest suburb
The closest suburb with confirmed data, named on the page.
- 4State estimate
Last resort, always labelled as an estimate.
Read the full methodology
AffordaLive uses a combination of sources depending on what's available for your suburb:
- Domain Insight: Suburb and council-area sale and rental data, updated monthly.
- ABS Census 2021: Income, demographic and household data by suburb and statistical area.
- AffordaLive suburb benchmarks: Independently compiled median price and rent estimates, built from government sales data and updated periodically. Used where Domain Insight data isn't available.
- Domain regional medians and state estimates: For remote suburbs with no Domain sales of their own, prices are estimated from the Domain median for the surrounding region (the part of the state outside the capital city). Only a place that isn't in our suburb list at all falls back to a state-wide estimate. Both are labelled as estimates.
- Official government databases: Stamp duty rates, first home buyer schemes, and council rate estimates. Sourced from state revenue offices and local government data. From 1 August 2026, Queensland's home and first home concessions require the buyer to be an Australian citizen, permanent resident, or specified foreign retiree. Our QLD stamp duty figures assume eligibility on this basis; non-eligible buyers should confirm their actual duty with the Queensland Revenue Office.
- LMI (Lenders Mortgage Insurance): Unlike stamp duty, there's no single official rate table for LMI. It's priced by private insurers (mainly Helia and QBE) and varies by lender, loan size, and your circumstances. Our LMI figures are estimates built from published indicative pricing; confirm the exact premium with your mortgage broker or lender before relying on it.
- Suburb locations: Incorporates or developed using G-NAF © Geoscape Australia, licensed by the Commonwealth of Australia under the Open Geo-coded National Address File (G-NAF) End User Licence Agreement, covering 14,000+ suburbs and localities across Australia.
Every suburb's prices and rents are labelled with their source, so you always know whether you're looking at Domain Insight data, our own benchmark, or a state estimate.
Suburb Affordability Reports · now available
Go deeper with a Suburb Affordability Report
A report sets your income against a suburb's prices, rents and running costs. The calculator covers one suburb at a time. A report goes further: a shareable PDF, in your inbox within minutes.

| Basic Lite$29.00 · 1 suburb | Basic$59.00 · your suburb + up to 3 nearby | |
|---|---|---|
| Your finances, the suburb's real costs and a score out of 100 | ||
| Deposit, price and interest-rate scenarios | ||
| A price-by-price table in $5k–$25k steps showing repayments, cash to settle and what's left over (rent reports: weekly rent in $5–$25 steps) | ||
| Rent vs buy, hidden costs and an action plan | ||
| Up to 3 nearby suburbs scored, plus a side-by-side comparison | – |
Choose a Rent or Buy report. Each suburb in your report gets its own table. Nearby suburbs are suggestions to compare, not a recommendation that any one suits you.
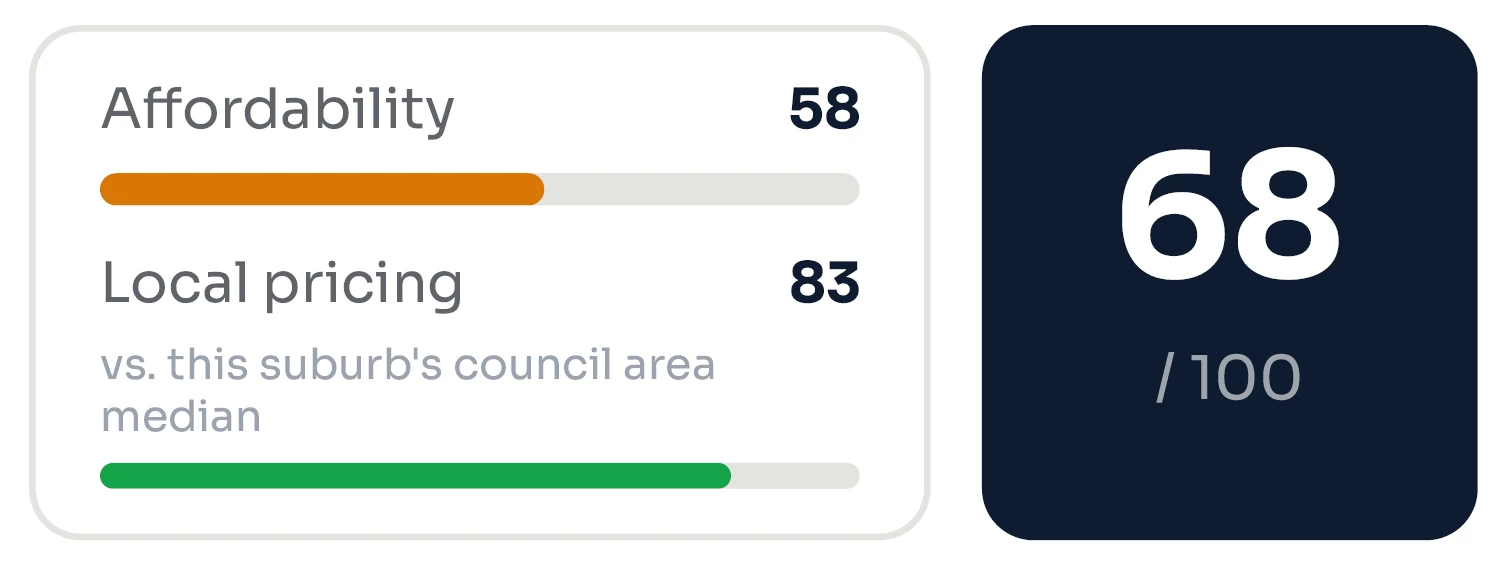
How suburbs are scored
- Affordability (main factor): cost as a share of your income
- Local pricing (secondary): price vs the council-area median
- A high score needs both. Cheap alone isn't enough.
Full scoring method
Every suburb in a report (your own pick and, on the Basic Report, the suggested alternatives) gets a score out of 100, based on two factors. Affordability, based on mortgage or rent as a percentage of your income, is the primary factor. Local pricing, based on suburb price compared against the median for its local council area (LGA) using real government-sourced sales data where it's available, is a secondary adjustment. Where a local council-area benchmark isn't yet available for a suburb, this factor is instead scored relative to the other suburbs shown in that report. This is disclosed on the suburb's page rather than presented as an equivalent comparison. A higher score means a suburb is comfortably affordable for your income and reasonably priced for its area. Being cheap isn't enough on its own, and neither is being technically affordable. The two factors are scored independently, so a suburb can be genuinely well-priced for its area while still being a stretch on your income. Where that happens, the report says so directly.
Where a suburb's price is estimated from a nearby suburb with verified data rather than its own independent figures, this is disclosed directly on that suburb's page in the report, with the source suburb and distance named. Never presented as equivalent to independently confirmed pricing.
Suburb deep dives, lifestyle fit and extended stress testing. Not available yet.
Not financial advice
AffordaLive (including both the free calculator and all paid reports) is an educational and planning tool only. All figures are estimates based on standard assumptions and publicly available data. Property prices, rental rates, and interest rates fluctuate.
Suggested suburbs in reports are selected using the same search radius and affordability criteria as your own pick, then scored by affordability relative to your income and by price relative to the local area. Being included isn't a recommendation that any of them suits your specific circumstances. They do not account for lifestyle preferences, employment location, school requirements, commute times, or other personal factors unless you use the Comprehensive Report.
Always consult a qualified financial adviser, mortgage broker, or conveyancer before making any property decision. See our full disclaimer for details.